To access the Meaningful Use Dashboard, click
Reports > Meaningful Use > Dashboard.
If you would like to use a saved configuration
that has been previously configured, you can highlight the applicable
configuration in the Configurations
section, and then click the Select
button. This will default all values that were selected for that configuration,
and the configuration name will appear in the Currently Loaded Configuration
field. You can make any modifications for your present needs.
In the Eligible Provider (NPI) fields, select
the Provider that you want to
generate a report for from the list.
In the Stage field, select Stage
1 2011, Stage 1 2014, Stage 1 2015, Stage
1 2016, Stage 2 2014, Stage 2 2015,
Stage 2 2016, Stage 2 2017,
or Stage 3 2018, depending upon
which stage requirements you want to run the report for.
In the Reporting Period fields, select the Date Range you want to generate the
report for.
In the Practice (TIN) field, select the Practice Tax ID Number you want to further
filter the selected measures for Stage 3 2018, if applicable. When a Practice
TIN is selected, it will be used as a filter on all applicable measures,
for the Eligible Provider selected, and will appear in the header when
printing.
NOTE: This field will become accessible only when the Stage 3 2018
option is selected in the Stage field, and will be disabled whenever a
different stage is selected.
Click the Meaningful
Use Requirements button to view the objectives and measures that
need to be satisfied to qualify for the various stages of Meaningful Use.
Click the Close button to close
this dialog.
On the left side of the Meaningful Use Dashboard
dialog are the ChartMaker Medical Suite
Unique Patient Count, Performance
Measures (for 2011 and 2014)/Objectives
(for 2015 - 2018), and Quality Measures
options. If you click the + next
to the applicable option it will expand to show the various reports for
the applicable measures.
The ChartMaker Medical Suite Unique
Patient Count option will display the total number of encounters
(based on charges in Practice Manager) versus the total number of Meaningful
Use encounters (in Clinical) and the calculated percentage for the selected
reporting period. This allows you to determine if 80% of the patients
seen during the reporting period have an electronic medical record, and
whether or not you can successfully attest for Meaningful Use. Do note,
that this calculation will only reflect results based on charges entered
in Practice Manager and chart notes being entered into the Clinical application.
If this is not the case, this will not provide an accurate percentage.
When running the ChartMaker Medical Suite Unique Patient Count report,
check this option, and be sure that any Performance and/or Quality Measures
are unchecked.
The Performance Measure/Objective
option contains the applicable branches and performance measure/objective
reports for the specific Stage
selected above.
The Quality Measure contains
additional branches and the applicable quality measure reports for the
specific Stage selected above.
Select the applicable Performance
Measures/Objectives and Quality Measures you want to generate a
report for.
NOTE: You can select the applicable measures or objectives by branching
down to the individual measures or objectives and checking each applicable
measure, or if you check the main heading (Performance Measures/Objectives
or Quality Measures) all measures/objectives below that option will be
selected. Likewise, you can check a subheading (Core, Menu Set, Alternative
Core, Specialties, etc.) and all options below that subheading will be
selected.
Selecting a group or any report will load those reports in the grid
to the right of the tree. In the grid there are columns for Measure
Description, Results Description,
Numerator, Denominator,
Result, Goal,
Denominator Exclusions, and Exceptions. When the screen is initially
loaded, all Numerator and Denominator fields will be blank and the Goal
will be pre-populated with the ARRA Stage requirement for percentage.
Once the applicable measurement options have been
selected for the provider, click the Calculate
Results button to generate the reports. When the calculations are
complete, the Numerator and Denominator columns will display the number
of results (zero if none), and the Result column will display the calculated
percentage. If the measure requirements are met, the result field will
display in green with the result percentage. If
the result percentage was below measure requirements, the field will be
displayed in red.
NOTE: When running Meaningful Use reports, if the data range configured
is for 90 days or more, a Meaningful Use Dashboard pop-up message will
appear providing information and a link to the CMS website about meeting
Meaningful Use Objectives, as well as reminding you to print the report
if you are using these results for Meaningful Use Attestation, then you
need to print the report in case of a CMS Audit. Click the OK
button, and then be sure to print the results if applicable.
After the reports have been generated, you have
the ability to Export to text,
Print, or create a file for CQM Reporting.
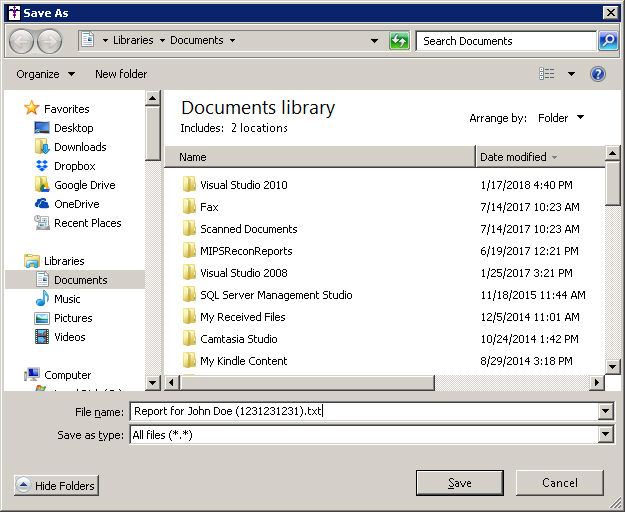
Click the Export to text button
to save the report results to your local machine as a .txt file. In the
Save As dialog, browse to the applicable Save
in location, modify the File name
as needed, and then click the Save
button.
Click the Print button to print
the results listed in the results grid in the Meaningful Use Dashboard.
Click the CQM Reporting button
to generate a QRDA file that can be submitted electronically to CMS during
attestation. In the Category field, select Category
1 or Category 3 depending
upon the type of file you want to send. Category 3 files are saved to
the desktop. Category 1 files are a zip file located in the rootdir under
QRDA\Cat1.
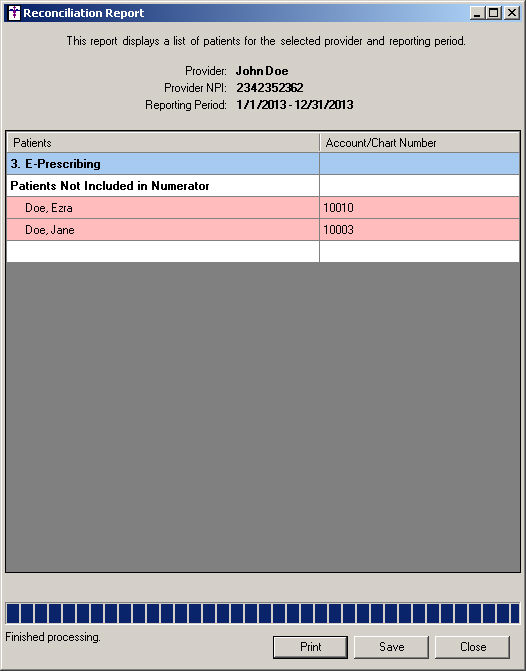
After the various report measures/objectives have
been calculated you also have the ability to generate a Reconciliation
Report. You have the option to display Patients
who are NOT included in the Numerator, those
Patients who are included in the Numerator, as well as Denominator
Exclusions and Exceptions (CQMs Only) by clicking the corresponding
options in the Reconciliation section of the Meaningful Use Dashboard.
Once the applicable options have been selected, highlight the particular
row or rows in the results pane, and then click the Generate
Reconciliation Report button.
A Reconciliation Report dialog will appear displaying a list of applicable
patients for each of the selected performance measures. Click the Print button to print this report. Click
the Save button to save this report
as a text file to a MeaningfulUseReconReports directory on your local
machine.
NOTE: When saving reconciliation reports you can modify the location
where report files are stored. The My Documents\MeaningfulUseReconReports
directory defaults if no alternative location is selected.
When finished, click the Close
button.
When finished saving or printing the results and/or generating any reconciliation reports, click the Close button.